Combatant Col
300 meters of ice at the foot of British Columbia’s highest peak.
We typically think of ice cores in the context of global climate. For instance, Antarctic ice cores demonstrate the link between greenhouse gases and temperature, both through glacial cycles (e.g. Dome C) and into the human era (e.g. Law Dome). What many don’t know is that some of the most powerful ice-core interpretation has been for regional climate rather than global. Take Richard Alley’s interpretation of the Younger Dryas from a Greenland ice core, GISP2. Noticing substantial precipitation changes in Greenland over very short timescales (~decades), he argued for changes in both atmospheric and ocean circulation in the North Atlantic as the Earth was coming out of the last glacial period. Ultimately, these changes led to a global climate event in the Younger Dryas, but the critical measurement for this inference was local to the North Atlantic around Greenland.
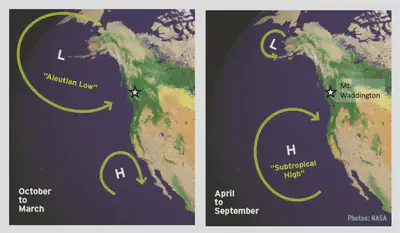
Here, we are focused on climate in the North Pacific and how that can be sampled using alpine ice cores from Southeast Alaska and, in this case specifically, coastal British Columbia. The North Pacific is dominated by two pressure systems, the Aleutian Low and the North Pacific High. Seattle-ites will be very familiar with the effects of these pressure systems. During winter, cold temperatures move the high pressure system to lower latitude and allow the Aleutian Low to grow which brings wet weather to Seattle and the broader Pacific Northwest. Alpine ice cores preserve the dynamics of this system and how it may have changed over the last ~few hundred years.
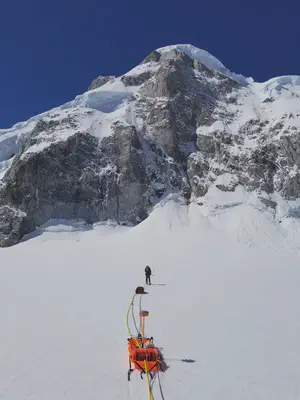
Mt. Waddington is the highest mountain in British Columbia. As may be expected for such a prominent piece of earth, it obstructs the wet air masses coming in from the Pacific and can get hammered with snow in the winter months. Our estimates were for ~12 meters of snow to the previous summer’s surface or ~7.5 meters water equivalent! Compare this to Seattle where it rains about 1 meter per year. Combatant Col, where we are looking to drill an ice core, rests between Waddington and its neighbor to the north, Mt. Combatant. Enough ice accumulates in this mountain saddle to make it a flat and relatively safe space to camp away from the avalanches and mountain debris coming off both peaks.
.](/blog/waddington/waddington_summit_hu69822adf3778783218d5352367cfe673_5919218_cc635e196097489ab7d7fda081699571.webp)
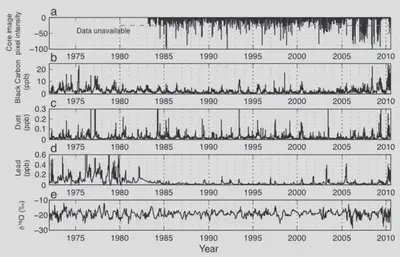
My colleagues at the University of Washington, Peter Neff (now at University of Minnesota) and Eric Steig, started work at Mt. Waddington for Peter’s M.S. degree (Neff et al., 2012). They were successful in drilling a 141-meter core but were obstructed from drilling any deeper by substantial water within the firn, what has now come to be known as a ‘perennial firn aquifer’ based on similar features in Greenland. Despite not extending as far in time as they had hoped, the results from their ice core are novel and interesting. Layer thicknesses (for precipitation) and water isotopes (for temperature) are used for local and regional climate interpretation. They sample black carbon within the core which comes from summertime smoke associated with regional wildfires. One of the interesting aspects of a future ice core will be extending this wildfire record well into the pre-industrial. They found a drop in lead concentrations in the 1980’s which, while not as interesting from an atmospheric process understanding perspective, demonstrates how effective policymakers can be in altering the atmosphere. Leaded gasoline was forcibly phased out starting with the Clean Air Act in 1970 but followed by a series of regulations and an outright ban in 1996. The firn core at Combatant Col recorded the response beautifully. These are the types of examples that give me hope in an era of rampant climate despair. Another example would be the CFC regulations in the Montreal Protocol now acting to heal the ozone hole.
Our objective in this field season was to more carefully survey the col with geophysical tools in preparation for another (hopefully deeper) ice core to be drilled in summer 2023. We used two distinct radar systems for two separate purposes. First, we used a 10-MHz radar to survey the ice thickness, with the idea being that this relatively low frequency wave should be able to propagate through some water in the firn aquifer to create a reflection off the ice-bed interface. Second, we used a 100-MHz radar to survey the firn aquifer itself. We get a strong reflection off the water table, so it is quite easy to know where there is standing water and its relative depth below the snow surface. We do not get a good reflection from the bottom of the firn aquifer, so it is harder to know the total volume of water present or how deep the water can infiltrate before all available pore space is closed off as the firn transitions into solid ice.
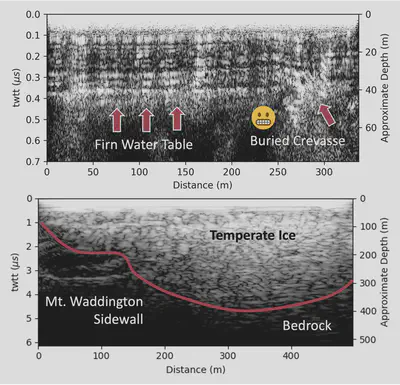
Our deep radar results look quite different from the stereotypical ice-penetrating radar profile which often has beautifully conformal stratigraphy and a glaringly bright bed reflection (see some examples here). Instead, we see a bit of a garbled mess, with scattering pretty much everywhere. In the field I found this quite frustrating, especially that we were not getting an obvious bed reflection. I spent about a day trying to adjust the radar settings to optimize for these wet conditions. With no significant improvement and a constrained timeline, I eventually decided we would go ahead and do the survey, that the radar instrument itself was working as well as it could be, and hoping that we could pull out a bit more information with careful post-processing. In the end, this has turned out to be the case. The data are high quality, there is simply so much water in this temperate ice that we see reflections off of everything through the entire ice column. We think that the bottom of these messy reflections delineates the boundary between ice and rock (roughly drawn in red on the figure). The shallow data are as expected, with a clear reflection at the water table in the firn, but also with a not-so-pleasant surprise of some buried crevasses at the edges of our surveyed area. Fortunately, they are deep and we were also quite careful roping up away from our camp.
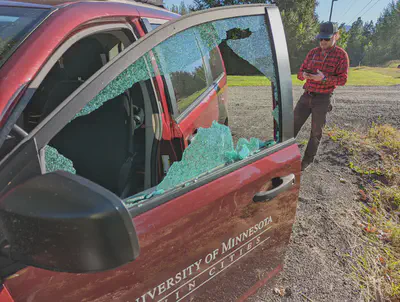
As with any field trip, this week in BC came with a few fun mishaps. We left Seattle early on a Wednesday morning, hoping to make the ~12 hour drive all the way to White Saddle in one day. Even before crossing into Canada we found ourselves on the side of the road with a car full of glass from Peter’s driver’s side window. An oncoming truck had kicked up a rock which shattered their window. Luckily, Peter stayed calm or it could have turned into a bigger accident. Having trouble scheduling an auto glass shop, Peter and his student Julia stayed at his mom’s house for the night (a situation Peter described as ‘his nightmare’, bringing his student to his mom’s house) while I continued onward. Even more eventful was our last night up on the col. I am a heavy sleeper, so I didn’t wake up until I heard my tent vestibule vigorously flapping in the wind. I poked my head out to check that it was still there and was greeted with some hefty gusts. A few minutes later I hear clashes and clangs from our kitchen tent followed by a series of profanities from Peter’s tent. Peter was up in an instant trying to chase it, but there was no chance, our tent was long gone.