Ice-Penetrating Radar
We study ice dynamics; namely, how the Greenland and Antarctic ice sheets are moving, how they may have been moving in the past, and how they will move into the future. Ice flows downhill under the force of gravity. As it moves to lower elevation, it eventually either melts or calves and floats away, both contributing mass to the oceans. Thus, the principal importance of our research is to put constraints on future projections of sea-level rise.
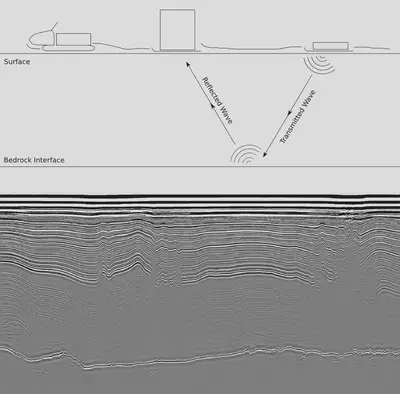
Being a geophysics team, the research tools that we use are a suite of geophysical methods including GPS, remote sensing (satellites), ice-penetrating radar, seismics, and physics-based computer models. With GPS and remote sensing methods we measure the elevation and velocity of the ice surface. We get at least cm precision with our GPS (down to mm when using real-time kinematics from a stationary base station). With radar and seismics, on the other hand, we survey the internal structure and intrinsic properties of the ice sheets. The basics of radar (seismic) methods are to transmit a radio (seismic) wave at the ice surface and to look (listen) for the reflections. The radio waves that we transmit are in the high to very-high frequency range (close to the same frequencies that you would use in your car or on a handheld radio). Seismics in glaciological applications are typically active source, using an explosion triggered at the surface. By measuring the time and amplitude of the returning waves (both radar and seismic), we learn what we need to build intuition about the dynamic nature of the ice-sheet system. Finally, we test our intuition using computer models.
In this post, I want to focus on radar methods for a couple of reasons. First, they are the primary focus of my personal research. In fact, I have never been on a seismic campaign. Second, our current field season at Herc Dome is a radar campaign.
Interestingly, the fact that radio waves penetrate ice was discovered not by a glaciologist, but by an atmospheric physicist. In the 1960’s, a man named Piggott had an ionosonde stationed on the Brunt Ice Shelf, looking for radio-wave reflections off of the ionosphere. Curious about the consistently absent signal at a regularly-spaced interval, he proposed that reflections from below (off of the ice-water interface at the bottom of the floating ice shelf) were interfering with his primary reflections from the ionosphere.
Of course, we now know that Piggott was correct and have since developed theory as to why radio waves move so easily through crystalline ice. Most of the electromagnetic spectrum is absorbed by ice (making it opaque), although at different rates and by different mechanisms depending on frequency. High-energy photons (microwaves to visible light and higher) are absorbed and converted to either lattice vibrations (heat) or electronic transitions (electron jumps to a higher shell). Low-energy photons (~kHz radio waves) are absorbed by Debye Relaxation (molecular rotations). This leaves an absorption gap for the ~MHz frequency range that we use in our research. Therefore, radio waves at these frequencies can easily image ice that is 3-4 km thick.
In using ice-penetrating radar to image the ice sheets, by far the strongest reflection comes from the ice-bedrock interface. This interface represents a permittivity contrast (i.e. that the radio wave travels faster through ice than it does through bedrock). Here it is useful to recall an illustrative demonstration on wave reflections from freshman physics. Take two ropes of unequal weight and tie them together. When a wave traveling through the lighter rope hits the knot between the two, some of the energy propagates forward as a wave in the heavier rope (although at a slower speed); however, the remaining energy is reflected back into the lighter rope in the direction from which it came. The idea in our ice-penetrating radar case is the same, with the knot in the rope being analogous to the ice-bedrock interface.
Having ~50 years of experience behind us, we are building progressively better radar systems with which we can see not only the extremely bright bed reflector, but also the dimmer internal reflectors from within the ice column. Similarly to the bed, these are permittivity contrasts which are typically a result of variations in the impurity content of the ice. The visible stratigraphy of the ice mapped by these internal reflectors leads to the somewhat obvious geometric interpretations of radar data, but we are also starting to use the information in the amplitude of the measured waveform for additional insight. For example, if the ice-bedrock interface is melted the reflection is brighter, so we can use the strength of a bed reflection to say something about the nature of the bed.
At Herc Dome we are using 3 radars. The first is a high frequency system (3 MHz) with which we can see to the bed of the ice sheet. Unfortunately though, there is a tradeoff between range and resolution, the 3 MHz antennae give us data that can be vertically resolved only to the scale of ~meters. For this reason, we also use a very-high frequency system (500 MHz) which gives us more like cm-scale resolution although its signal is fully attenuated by about 20 m below the surface. The third system is a phase-coherent radar called the ApRES (autonomous phase-sensitive radio-echo sounder). This system is a bit more complicated so I will not get into the details, but it essentially uses the additional phase information in the waveform to allow incredibly high precision for changes in time. Hence, we can use the ApRES to measure layer motion on the order of mm.
The primary goal of this and following seasons (hopefully two more in 2019-21) are to survey Herc Dome in order to provide guidance for ice-core drilling at this location. We are looking for signs of stability and hopefully a frozen bed. The dream result would be to find a feature called a ‘Raymond Bump’ which forms in the case of a steady divide location for at least a few tens of thousands of years. The bump would indicate a good drilling site because it demonstrates that the ice is not melting at the bed in that location, we would know that the seasonal layers have been well-preserved within the ice, and it implies stability close to the last interglacial which is the time period we are interested in.
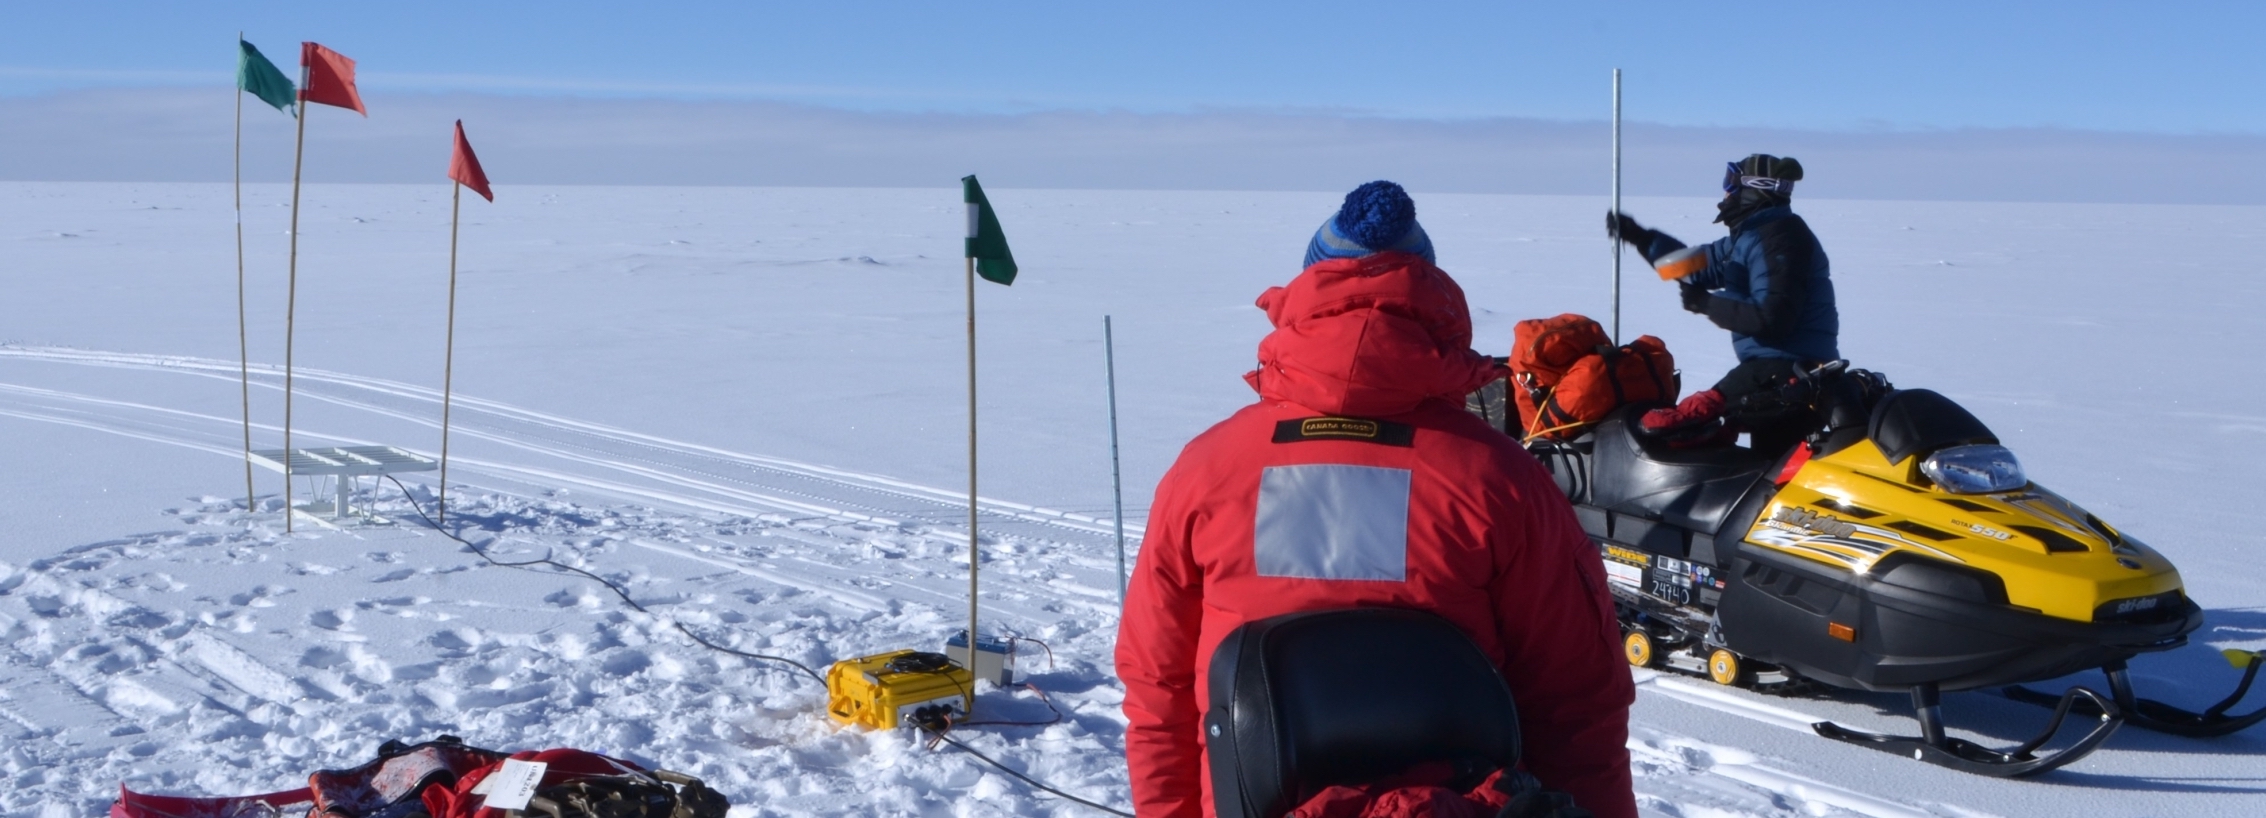
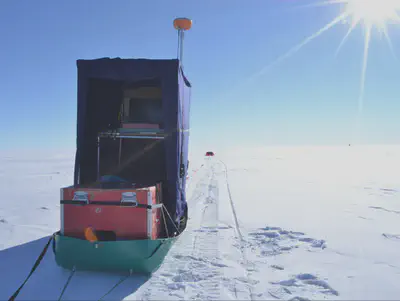
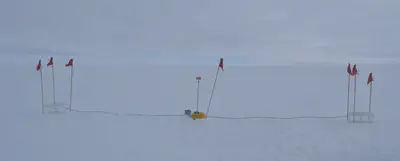
Our day-to-day in the field is mostly spent on a snowmobile or in the radar shelter where we keep the computer while it logs incoming data. All day, we drive around in the flat white expanse. In a way, traversing the ice-sheet surface feels like navigating the sea; there is nothing to be seen except H2O in any direction, and we even use marine GPS. The sastrugi feel like waves and could make one a bit ‘sled sick’ from the sled-rocking motion. We work long days when we are out, but once we get the radar system going it is not exactly strenuous work. The hope is that we sit back and watch the data come in. Of course, when instruments break our lives get a bit more complicated, and this is somewhat inevitable when it is -30°C and we have a bumpy route over sastrugi.